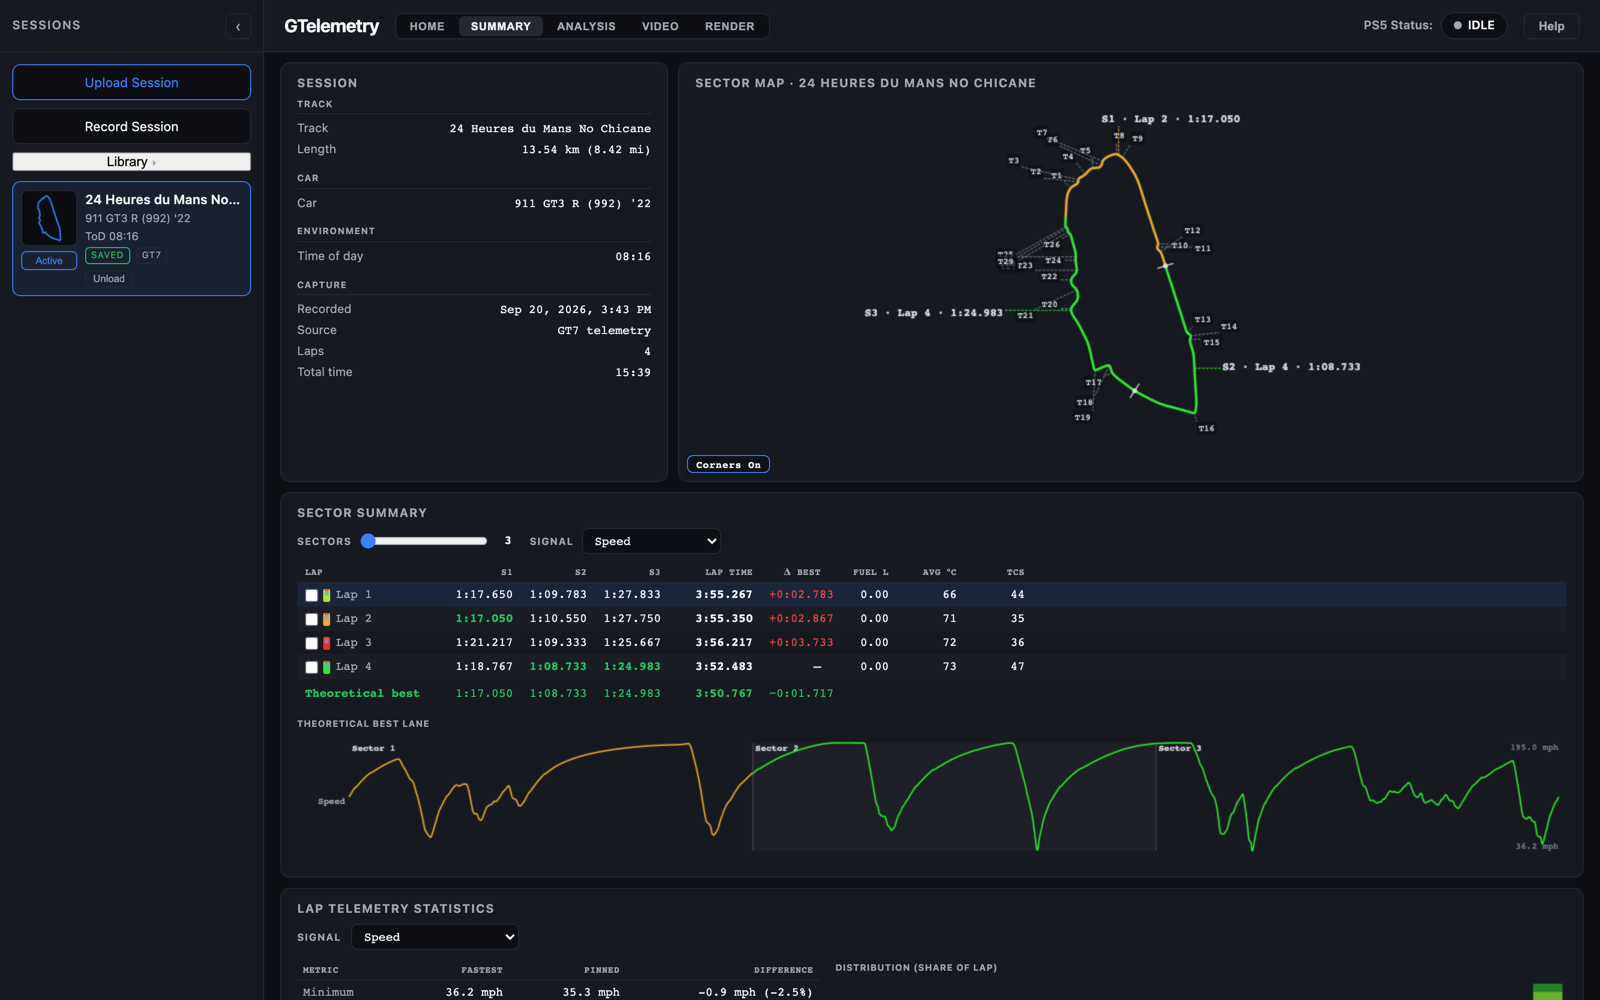
Every session,
at a glance.
Sector splits, track map, theoretical best — the moment a session loads, GTelemetry lays out exactly what happened, lap by lap. No digging through raw data to find the story.
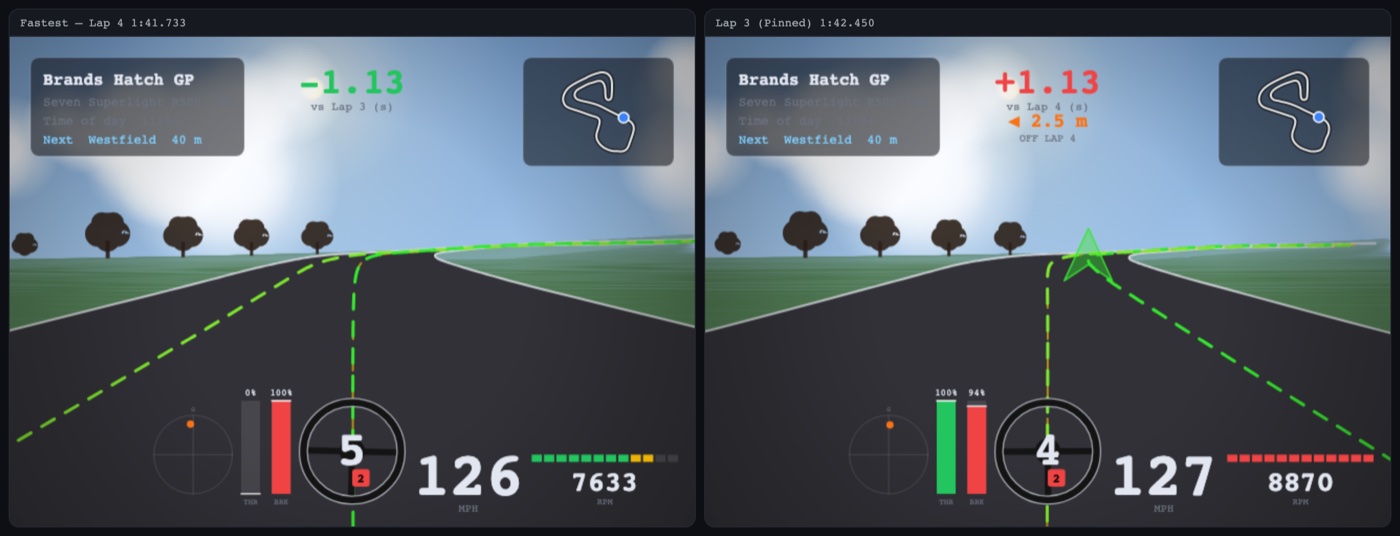
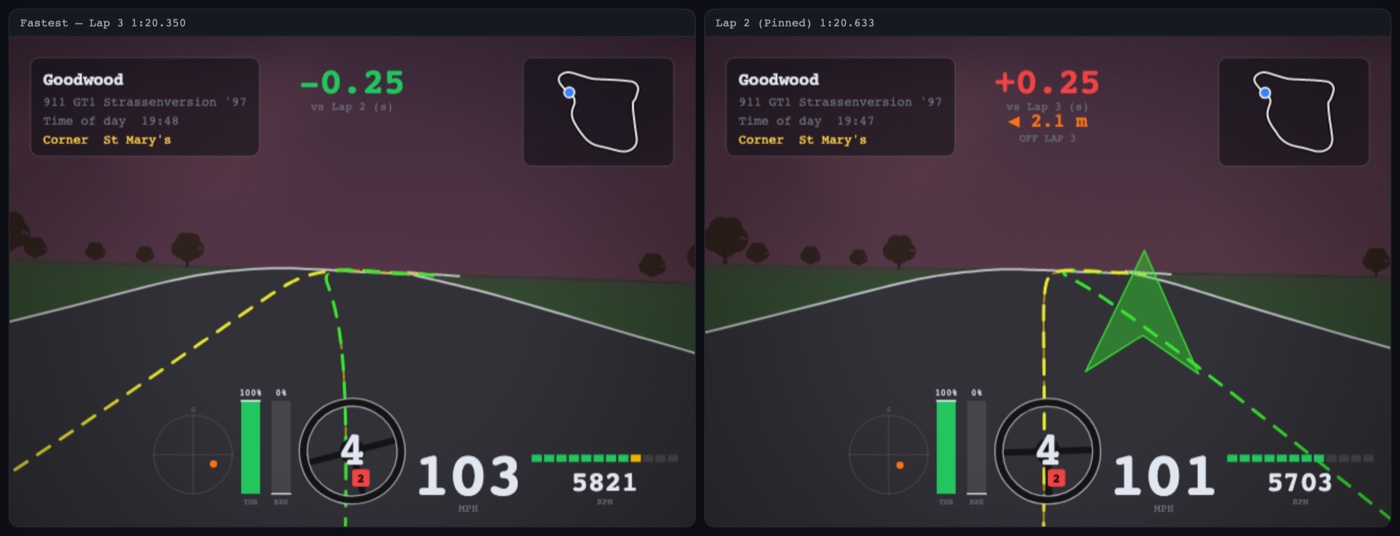
Ride along with yourself.
A full driver's-view reconstruction, built purely from telemetry — real corner names, trackside scenery, two laps compared side by side, any circuit, any time of day. Nothing recorded, everything rebuilt.
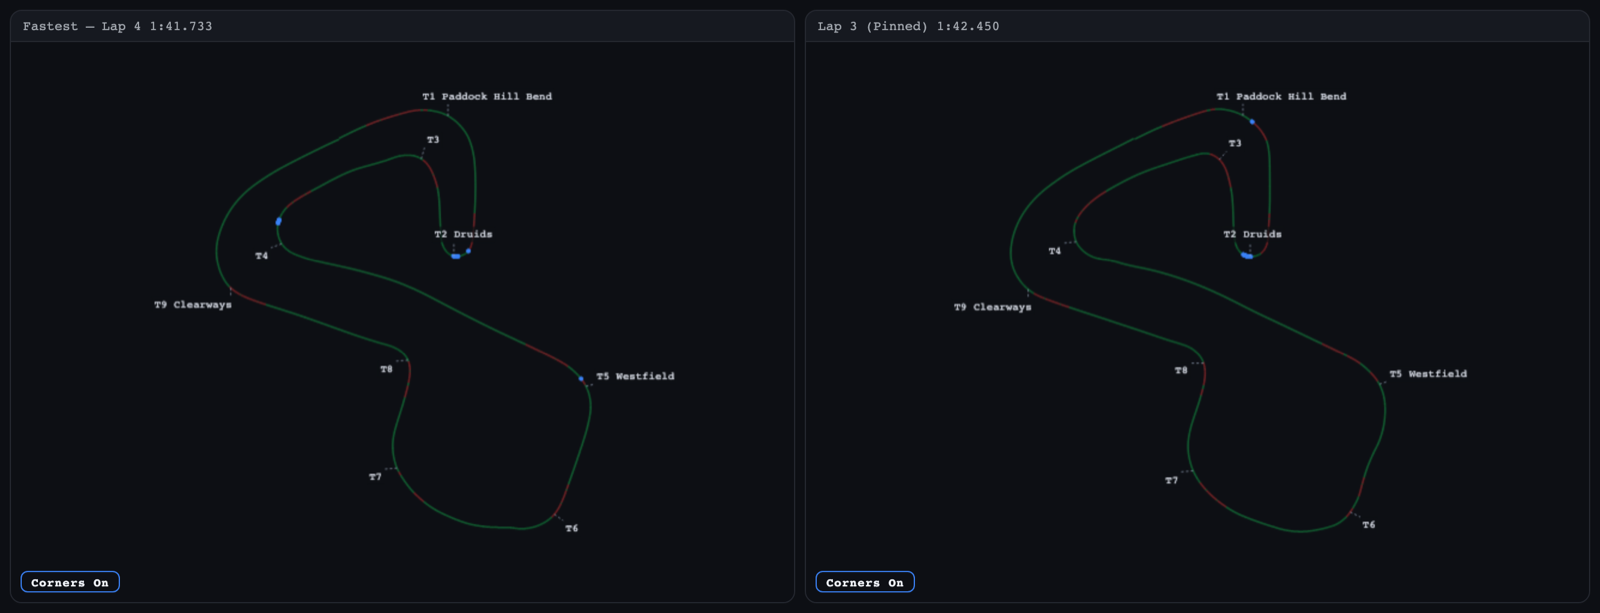
See exactly
where it happens.
Every analysis card doubles as a track map — coasting, braking, traction, all of it recoloured onto the racing line with real corner names, fastest lap next to pinned, side by side. The same events also line up in an Analysis Lane on the timeline below your laps, so you can hover any moment and jump straight to that exact point on track.
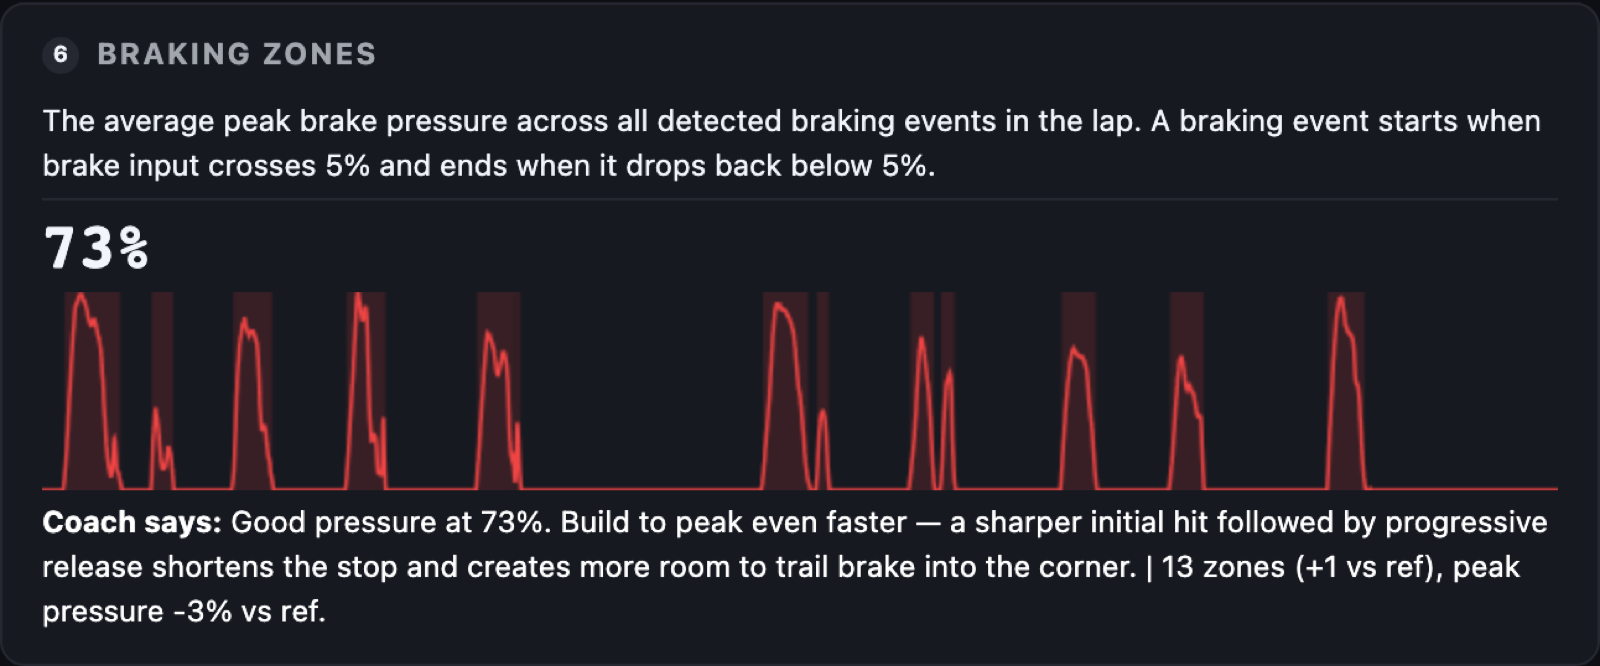
Thirteen coaches.
Zero guesswork.
Braking zones, throttle application, traction circle utilization, driving line — thirteen focused diagnostics compare your pinned lap against your fastest, and tell you exactly where time is won or lost.
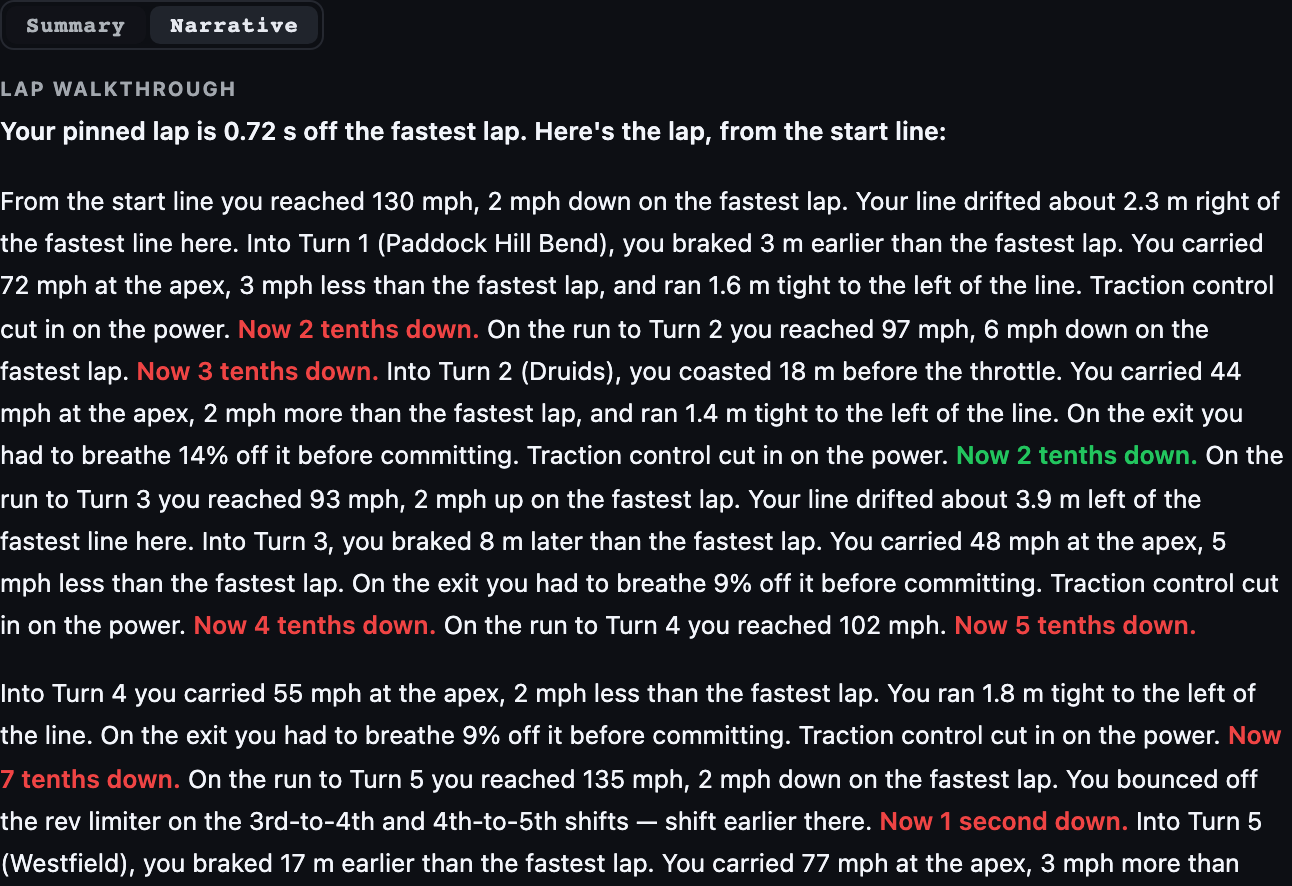
Or just read
the whole lap.
Every card's findings melded into one plain-English walkthrough — corner by corner from the start line, exactly where you gained and lost time, and what to try next.
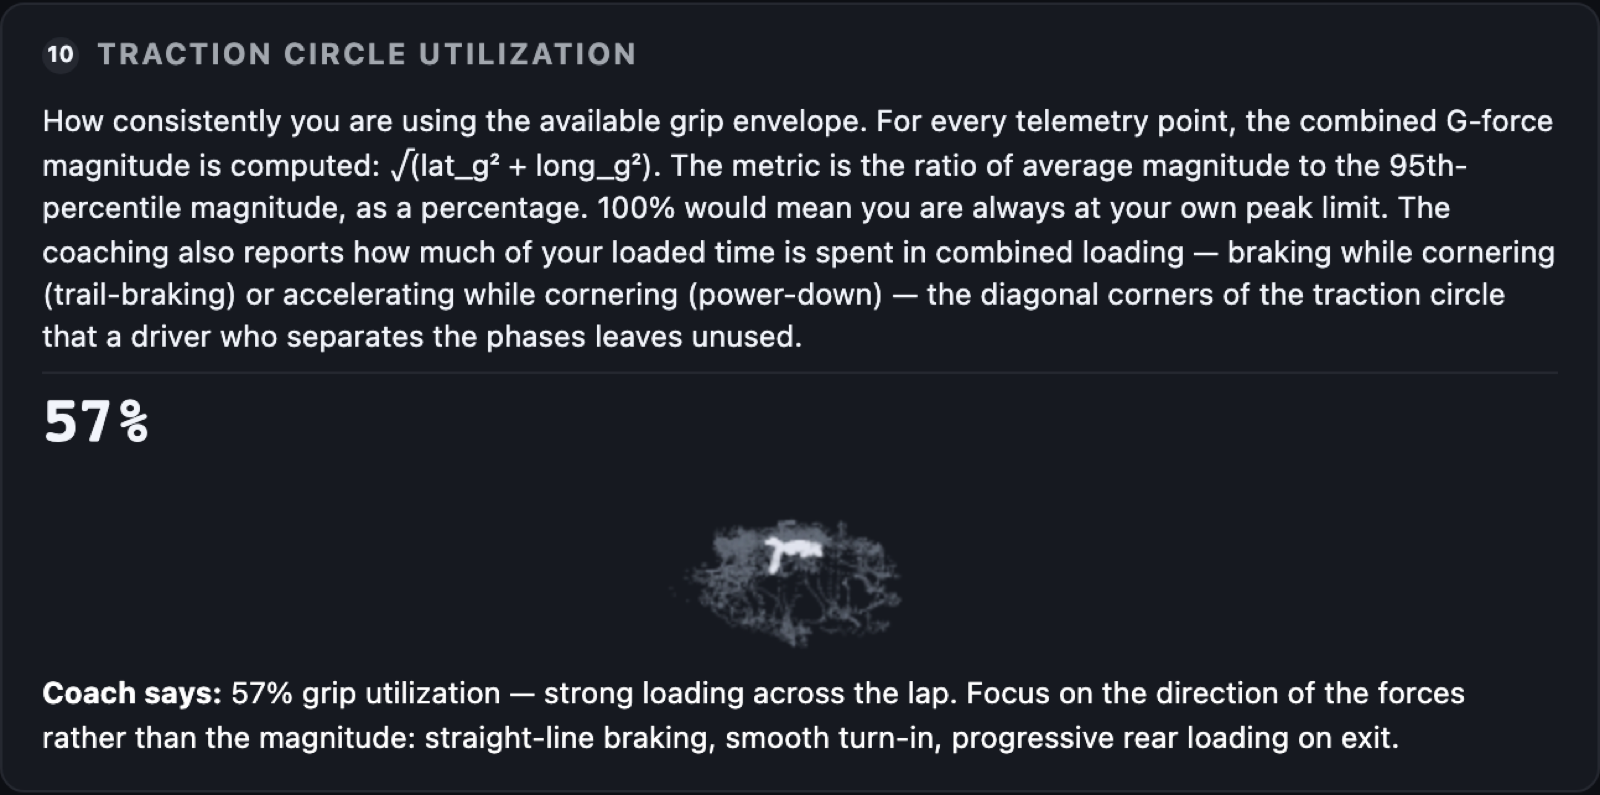
See the grip
you're leaving on the table.
Every telemetry point plotted by lateral and longitudinal G — a filled disc means you're consistently at the limit. Gaps in the circle show exactly where you're not.
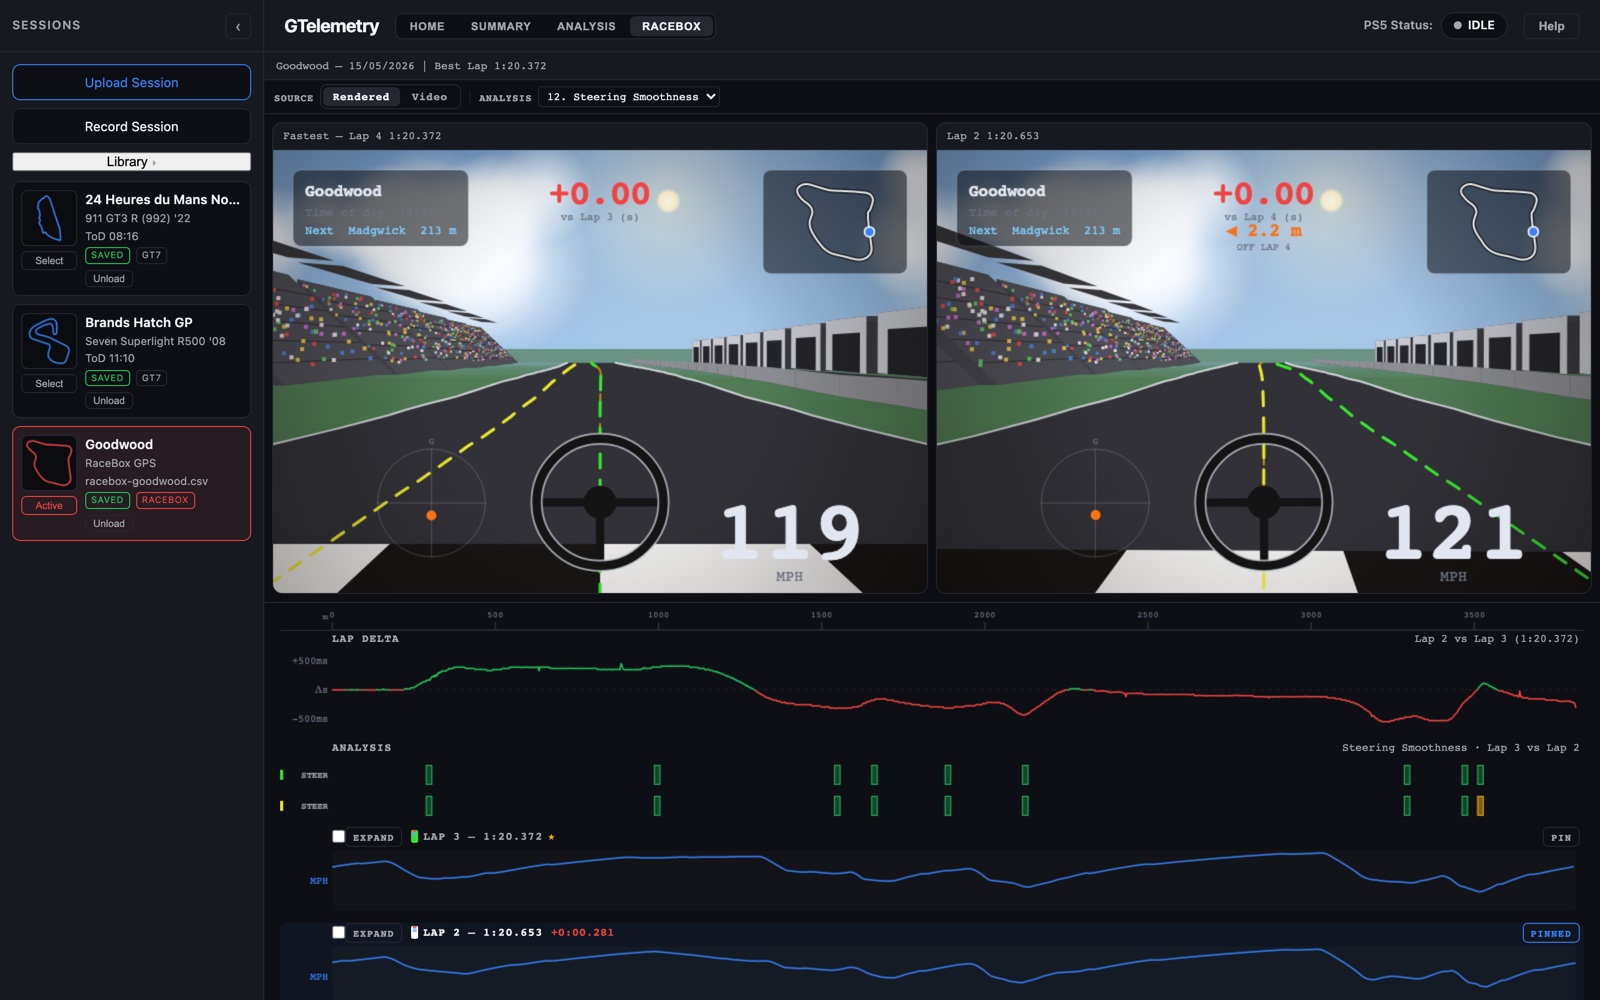
Not Just Sim Laps.
Import a RaceBox GPS lap-timer session from a real track day and get the same driver's-view render, the same lap comparison, the same coaching — built from GPS and IMU alone.